What would a data breach cost your organization this year? What about a ransomware attack or a natural disaster that takes down your primary data center?
These questions are the foundation of quantitative risk assessment.
Annual loss expectancy gives you a number instead of a vague "high" or "medium" rating. This number is an actual dollar figure for the expected monetary loss from a specific risk over a single year and changes how you prioritize security spending.1
What Is Annual Loss Expectancy?
What is annual loss expectancy? It is the expected yearly financial loss an organization can anticipate from a particular threat. First introduced in the 1970s for insurance calculations, it has become a cornerstone of cybersecurity risk management.2
Instead of relying on gut feelings or a subjective approach, annual loss expectancy turns potential risks into a common monetary measure for risk evaluation.
If you know a specific risk will cost your business $120,000 every year, you can make informed decisions about how much to spend preventing it. A risk with an ALE of $500,000 justifies a $200,000 remediation cost.3
ALE is an average estimation that represents the expected loss over time. It is not a guarantee of what will happen in any single year.
The ALE Formula: How to Calculate Annual Loss Expectancy
The ALE formula is straightforward:1
Annual Loss Expectancy (ALE) = Single Loss Expectancy (SLE) x Annual Rate of Occurrence (ARO)
Each input requires careful assessment and reliable data.
Understanding Single Loss Expectancy and Exposure Factor
Single loss expectancy is the cost of a single occurrence of a risk event. How much do you lose when this threat happens once?4
Single Loss Expectancy (SLE) = Asset Value x Exposure Factor
Asset value is the total worth of the asset at risk, including hardware cost, data worth, replacement expenses, and regulatory fines. If your customer database has an asset value of $2 million, that is your starting point.
Exposure factor is the percentage of the asset you expect to lose in a single incident. An exposure factor of 40% means you lose 40% of the asset value. A 100% exposure factor means total loss.3
Single loss expectancy SLE helps organizations assess potential financial losses from risks. It is a key input for calculating ALE.4
Annual Rate of Occurrence Explained
The annual rate of occurrence tells you how often a specific risk event is expected to occur in a year.2
ARO can be a whole number or a fraction. A security breach that happens twice a year has an ARO of 2. A natural disaster that strikes once every five years has an ARO of 0.2.5
Historical data helps estimate the annual rate of occurrence. Organizations pull from incident logs, industry reports, and threat intelligence feeds to determine realistic ARO values.
Malware infection: ARO of 3.0 (three times per year)
Major data breach: ARO of 0.1 (once per decade)
Ransomware attack: ARO of 0.5 (once every two years)
Power outage: ARO of 1.0 (once per year)
How to Calculate Annual Loss Expectancy ALE: Step by Step
As an example: your organization has a web application with an asset value of $1,500,000. Historical data shows ransomware targets similar applications once every two years. The exposure factor is 30%.
Step 1: Calculate single loss expectancy
SLE = Asset Value x Exposure Factor SLE = $1,500,000 x 0.30 SLE = $450,000
Step 2: Determine the annual rate of occurrence
ARO = 0.5 (once every two years)
Step 3: Calculate annual loss expectancy
ALE = SLE x ARO ALE = $450,000 x 0.5 ALE = $225,000
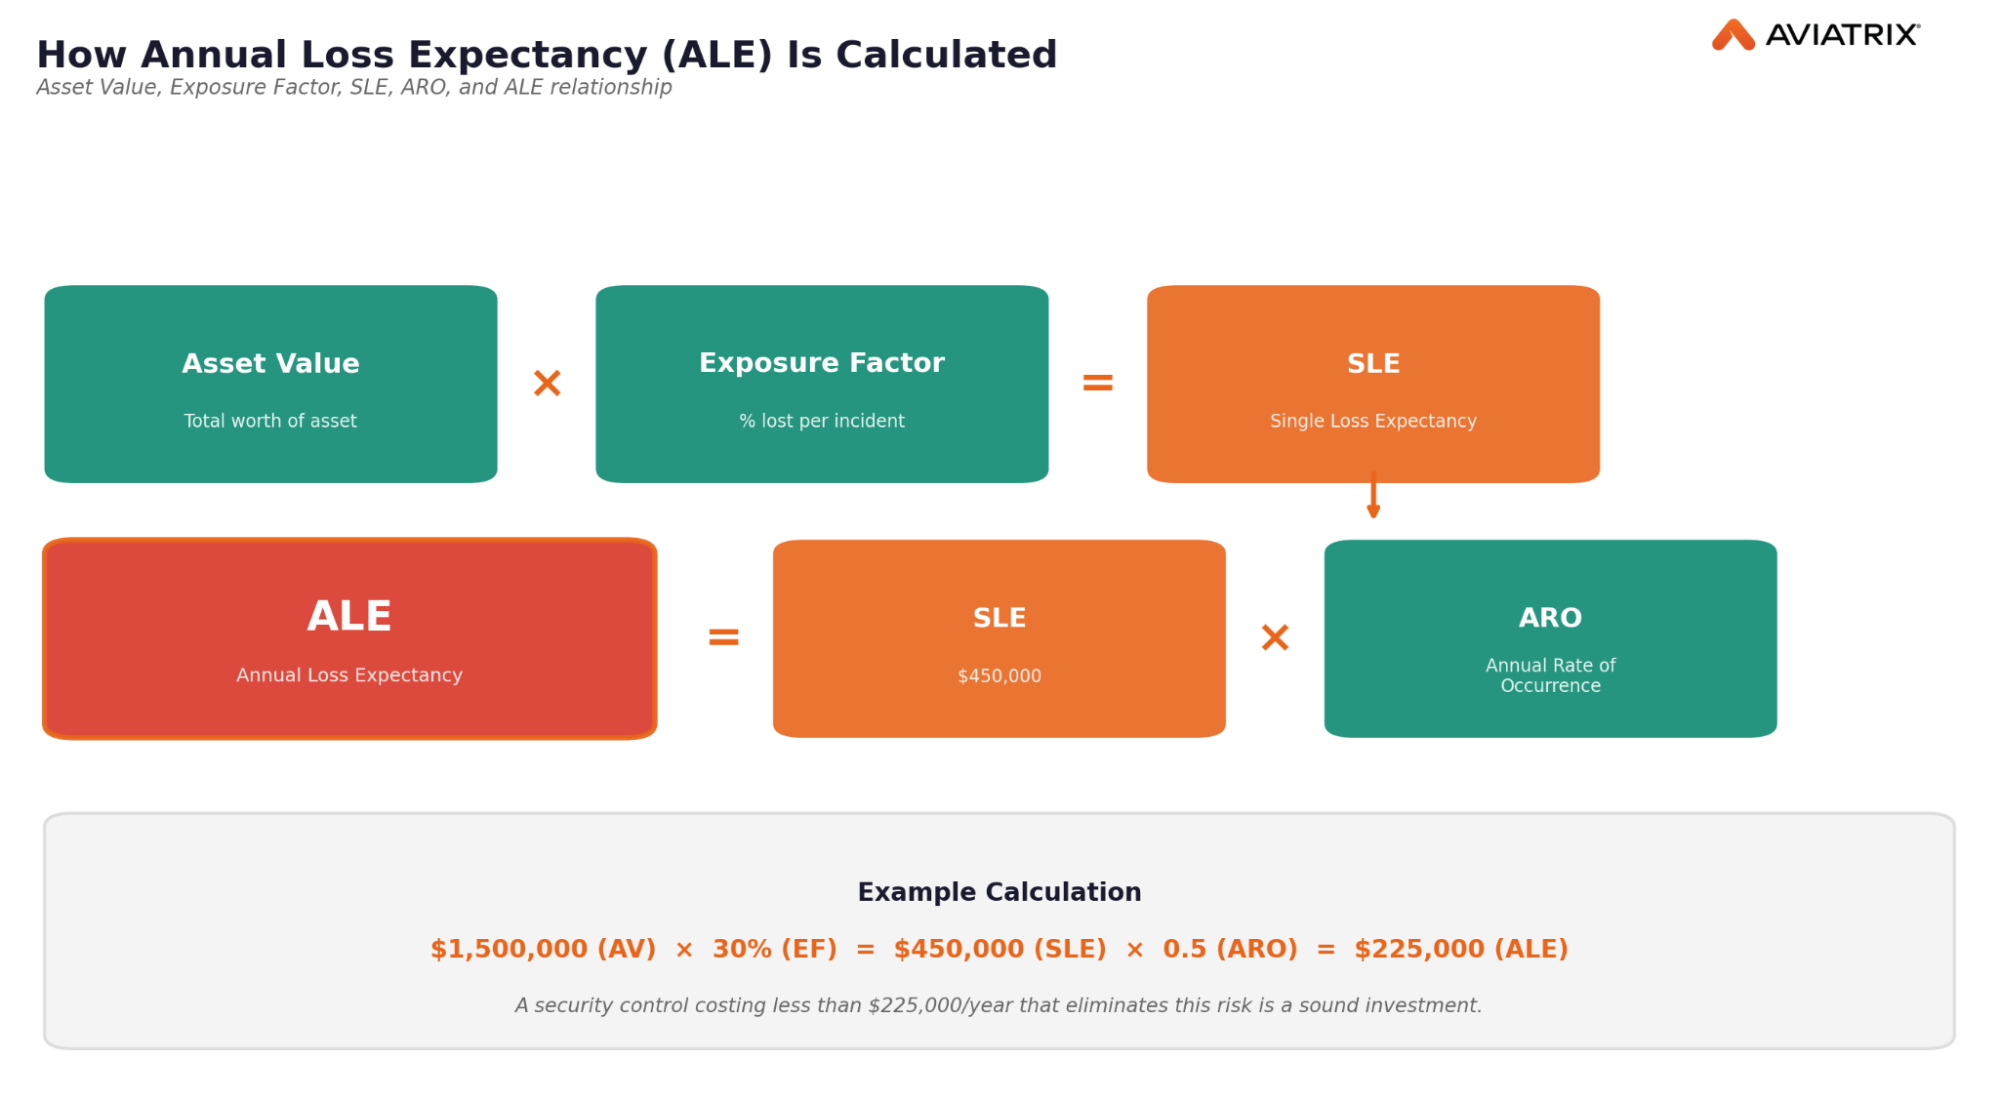
This tells you the expected monetary loss from ransomware against this application is $225,000 per year. Any security control costing less than $225,000 annually that eliminates this risk is a sound investment.1
Annualized Loss Expectancy for Cybersecurity Risk Prioritization
When you calculate ALE for every major threat in your environment, you can rank them by financial impact.3
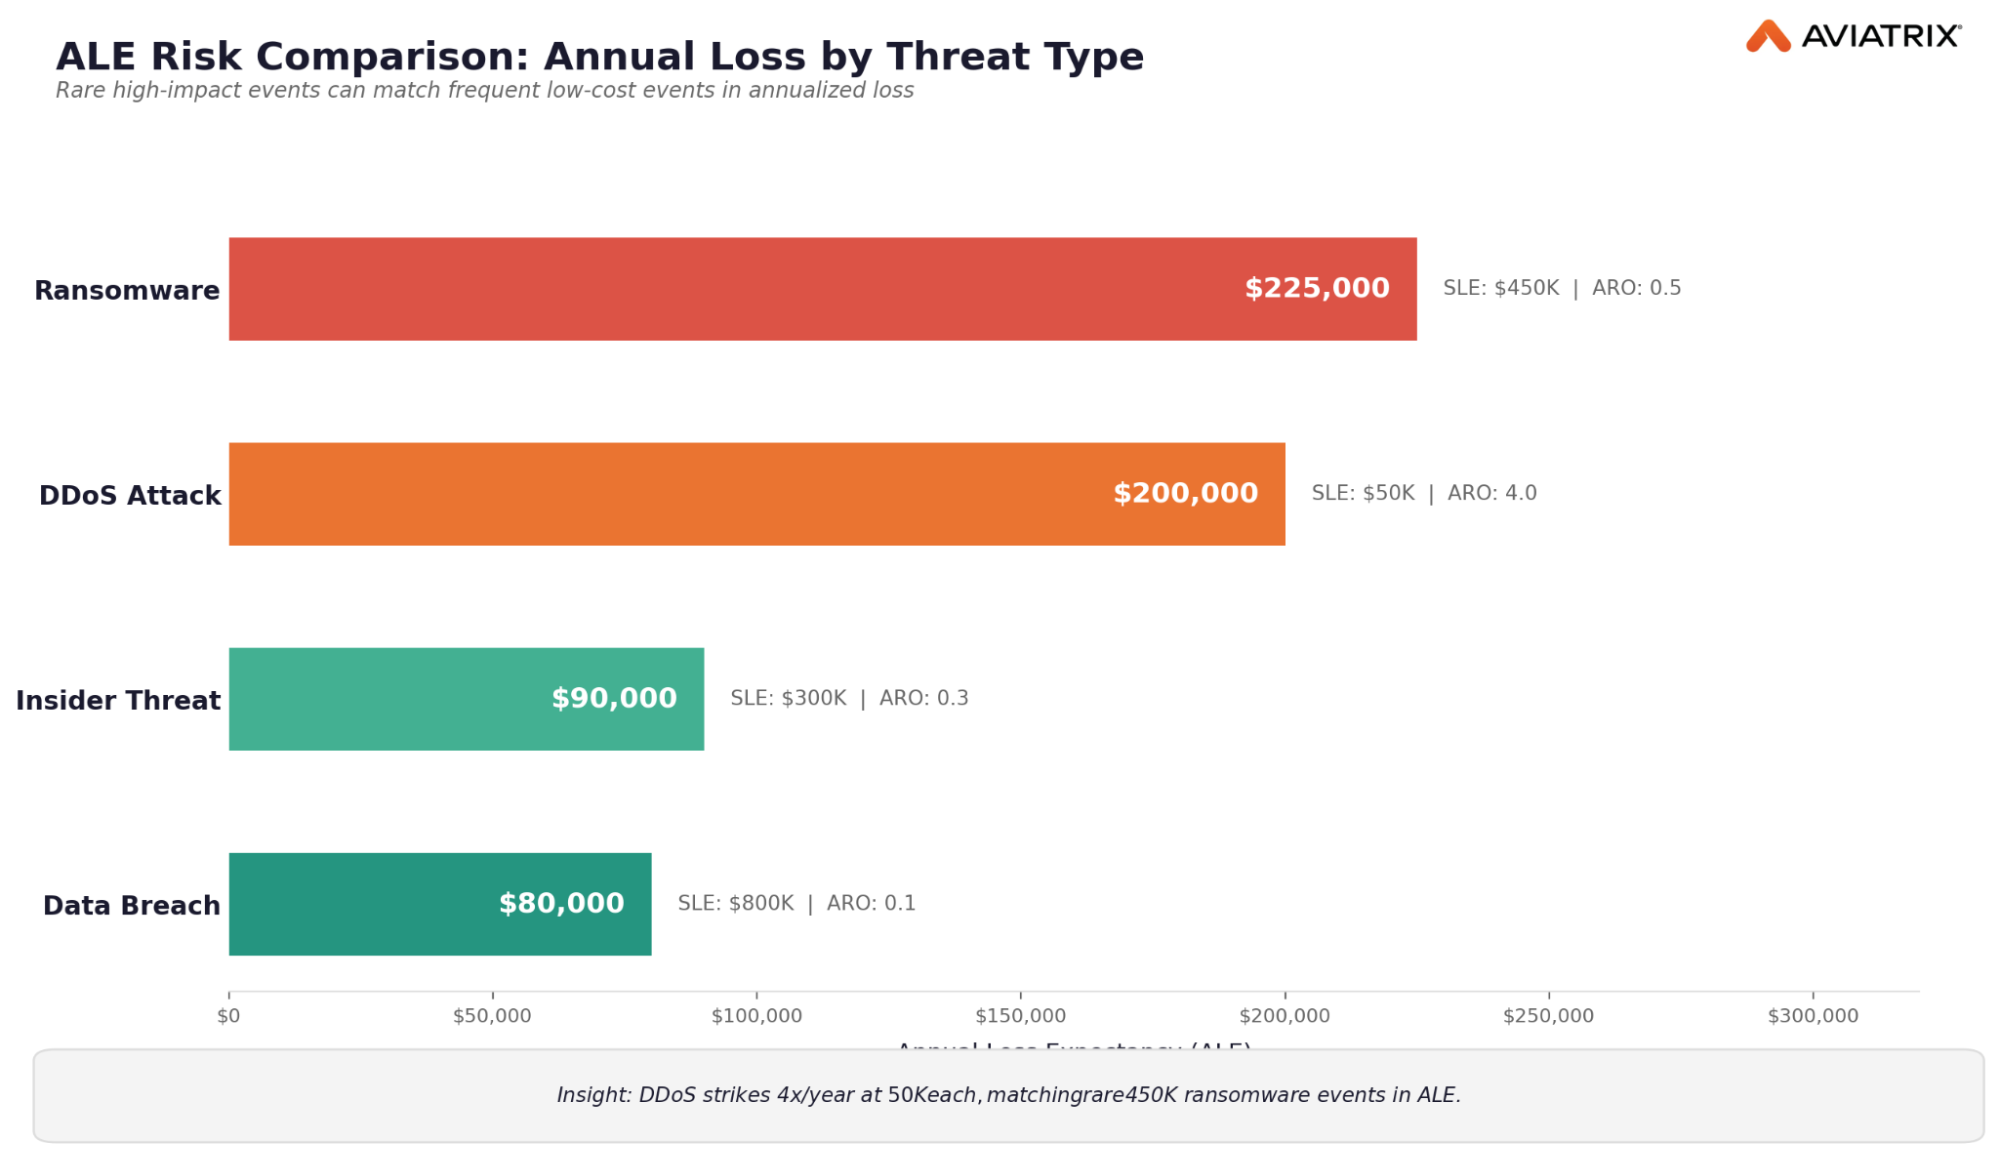
Rare events with significant impacts can have similar ALEs to frequent minor events. Ransomware hits once every two years but hits hard. DDoS strikes four times a year but each one costs little. Their annualized loss expectancy figures are close.2 This quantitative analysis helps you prioritize where to spend.
Budget Justification and Annual Loss Reduction
Annualized loss expectancy directly supports budget justification. Demonstrating potential savings from reducing ALE gives security leaders a clear business case for every investment.4
Risk reduction through annualized loss expectancy analysis connects security spending to financial impact. Risk management efforts become measurable when every control has a dollar value.
If deploying endpoint detection reduces ransomware exposure factor from 30% to 5%, you can calculate exactly how much that saves annually.5
Prioritizing Investments for Different Risks
Not all risks deserve the same attention. Annualized loss expectancy lets you compare different risks on a common scale, the expected monetary loss per year.
Potential threats that produce high ALE numbers get funded first. Potential losses below the security budget threshold get accepted or deferred. Risk management efforts translate into strategic resource allocation.
The total cost of ownership for a security control must stay below the annual loss it prevents. Otherwise, you are spending money to destroy value instead of protecting it.
Asset Value: Getting the Loss Expectancy Foundation Right
Everything in the ALE formula starts with asset value. Get it wrong, and every downstream calculation is off.
Asset value includes more than purchase price. Consider replacement cost, lost revenue, regulatory fines, reputational damage, and the value of sensitive information stored on the asset.1
A server might have an asset value of $10,000 in hardware. But if it hosts data worth $5 million, the true asset value is far higher. Every organization should maintain a current asset inventory with realistic values.
Annual Rate and Historical Data: Estimating Threat Frequency
Estimating how often threats strike is where uncertainty ranges enter the picture.
Historical data from your own environment is the best source. Past security incidents, near misses, and industry benchmarks all feed into ARO estimates. Manage risk effectively by supplementing internal data with industry studies and expert judgment.5
Annual rate estimates for rare but catastrophic events often lack sufficient data. This is where quantitative risk assessment meets its biggest limitation: the rate of occurrence ARO is crucial for calculating ALE. Without a defensible ARO, the entire calculation rests on guesswork.
Loss Expectancy ALE vs. Qualitative Cybersecurity Risk Assessment
Not every organization uses quantitative analysis. Many rely on qualitative methods, rating risks as high, medium, or low based on expert opinion. That is a subjective approach.3
Loss expectancy ALE provides something qualitative methods cannot: a dollar figure. Quantitative risk assessment predicts risk outcomes and costs. Qualitative assessment describes them.
The best risk management programs use both. Qualitative methods help identify and evaluate potential threats quickly. Annualized loss expectancy quantifies the ones that matter most for cybersecurity risk decisions.
Quantitative analysis aids in making data-informed business decisions. ALE provides the numbers, while qualitative methods provide the context. Together, they strengthen cybersecurity risk management as a process.
Limitations of Annual Loss Expectancy
Annual loss expectancy is powerful, but it is not perfect.2 ALE assumes a stable environment, but potential risks evolve. Every new vulnerability introduces a fresh attack surface. Threat actors change tactics, so an ALE calculated today may not reflect tomorrow's reality.
Exposure factor estimates are often educated guesses, but different risks affect assets in unpredictable ways. The potential impact of a security incident can vary wildly from one occurrence to the next.
Cascading Costs and Financial Impact
Single loss expectancy can miss cascading effects. A security breach might trigger regulatory fines, lawsuits, and brand damage. The financial loss sometimes exceeds what the formula predicts.
Use ALE as a guide, not a guarantee. A given risk might destroy 20% of an asset in one scenario and 80% in another. Build uncertainty ranges into your estimates and revisit calculations regularly as a process to keep risk management current.
Sources
NIST, "Risk Management Framework for Information Systems and Organizations," https://csrc.nist.gov/publications/detail/sp/800-37/rev-2/final
ISACA, "Quantitative Risk Analysis and Annual Loss Expectancy," https://www.isaca.org/resources/glossary
CIS, "CIS RAM: Risk Assessment Method," https://www.cisecurity.org/insights/white-papers/cis-ram
SANS Institute, "Quantitative Risk Analysis Step by Step," https://www.sans.org/white-papers/quantitative-risk-analysis/
FAIR Institute, "Introduction to Factor Analysis of Information Risk," https://www.fairinstitute.org/what-is-fair